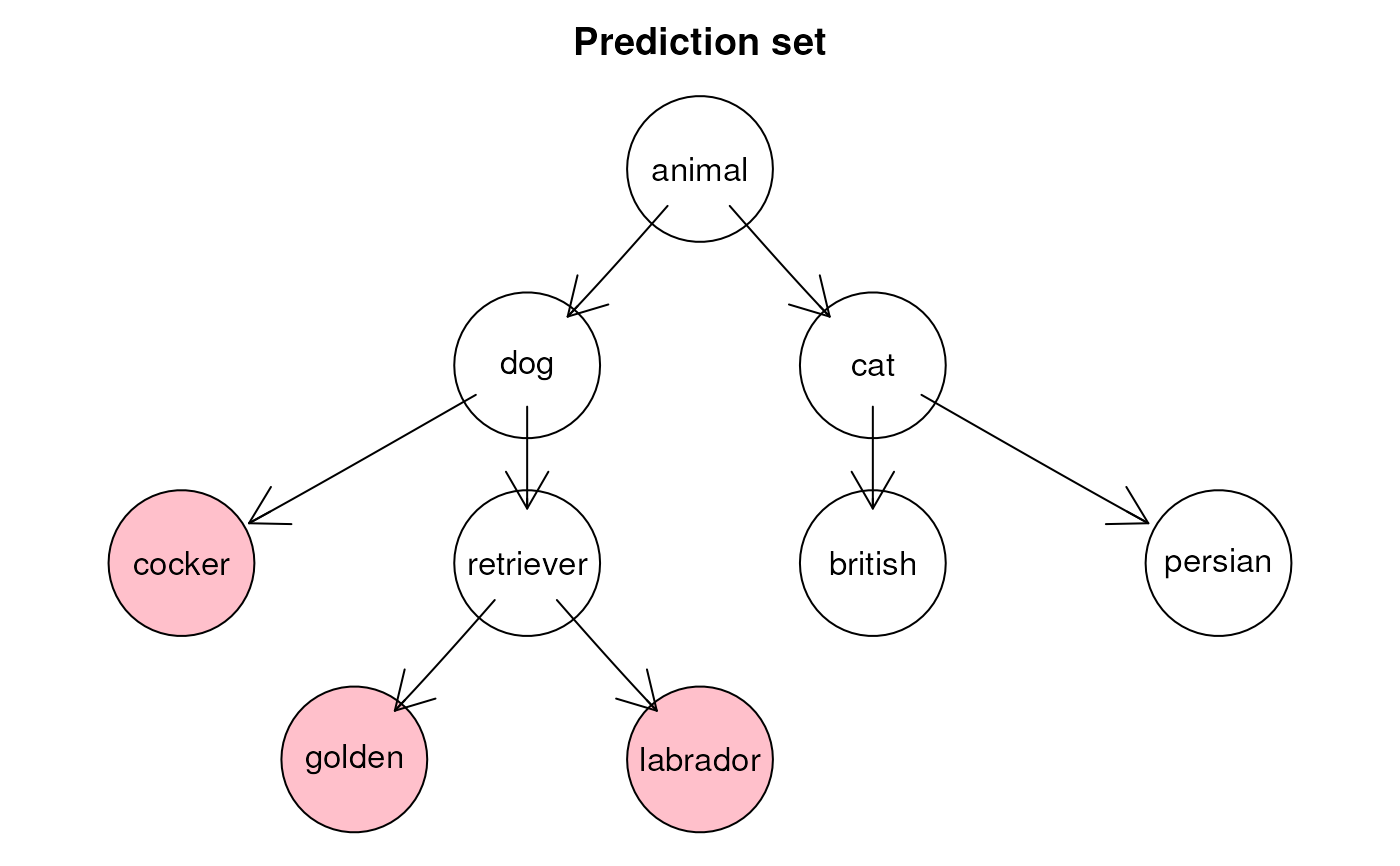
This function takes as input a prediction set and an ontology and plots the ontology, highlighting the labels included in the set.
plotResult(
  pred_set,
  onto,
  probs = NULL,
  col_grad = c("lemonchiffon", "orange", "darkred"),
  attrs = NULL,
  k = 4,
  title = NULL,
  add_scores = TRUE,
  ...
)
Arguments
- pred_set
character vector containing the labels in the prediction set
- onto
ontology as an igraph
- probs
estimated probabilities for the classes
- col_grad
color to use to highlight the classes
- attrs
other grtaphical attributes
- k
number of decimal digits to consider in
probs- title
title of the plot
- add_scores
boolean. If
TRUE, estimated probabilities are added to the name of the classes- ...
general commands to be sent to plot
Value
a plot of the ontology with the considered classes colored
Examples
library(igraph)
# Let's build a random ontology
onto <- graph_from_literal(
    animal-+dog:cat, cat-+british:persian,
    dog-+cocker:retriever, retriever-+golden:labrador
)
# Let's consider this prediction set
pred_set <- c("golden", "labrador", "cocker")
plotResult(pred_set, onto,
    col_grad = "pink", add_scores = FALSE,
    title = "Prediction set"
)
