PFAM domain-domain association analysis
PFAM.RmdSetup
library(BioPlex)
library(AnnotationDbi)
library(AnnotationHub)
library(PFAM.db)
library(graph)
library(ggalluvial)
Data retrieval
Get the latest version of the HCT116 PPI network:
bp.hct116 <- BioPlex::getBioPlex(cell.line = "HCT116", version = "1.0")## Using cached version from 2023-01-14 23:49:23and turn into a graph object:
hct.gr <- BioPlex::bioplex2graph(bp.hct116)
hct.gr
## A graphNEL graph with directed edges
## Number of Nodes = 10024
## Number of Edges = 70421Annotate PFAM domains to the node metadata:
Connect to AnnotationHub:
ah <- AnnotationHub::AnnotationHub()OrgDb package for human:
## OrgDb object:
## | DBSCHEMAVERSION: 2.1
## | Db type: OrgDb
## | Supporting package: AnnotationDbi
## | DBSCHEMA: HUMAN_DB
## | ORGANISM: Homo sapiens
## | SPECIES: Human
## | EGSOURCEDATE: 2022-Sep12
## | EGSOURCENAME: Entrez Gene
## | EGSOURCEURL: ftp://ftp.ncbi.nlm.nih.gov/gene/DATA
## | CENTRALID: EG
## | TAXID: 9606
## | GOSOURCENAME: Gene Ontology
## | GOSOURCEURL: http://current.geneontology.org/ontology/go-basic.obo
## | GOSOURCEDATE: 2022-07-01
## | GOEGSOURCEDATE: 2022-Sep12
## | GOEGSOURCENAME: Entrez Gene
## | GOEGSOURCEURL: ftp://ftp.ncbi.nlm.nih.gov/gene/DATA
## | KEGGSOURCENAME: KEGG GENOME
## | KEGGSOURCEURL: ftp://ftp.genome.jp/pub/kegg/genomes
## | KEGGSOURCEDATE: 2011-Mar15
## | GPSOURCENAME: UCSC Genome Bioinformatics (Homo sapiens)
## | GPSOURCEURL:
## | GPSOURCEDATE: 2022-Aug31
## | ENSOURCEDATE: 2022-Jun28
## | ENSOURCENAME: Ensembl
## | ENSOURCEURL: ftp://ftp.ensembl.org/pub/current_fasta
## | UPSOURCENAME: Uniprot
## | UPSOURCEURL: http://www.UniProt.org/
## | UPSOURCEDATE: Fri Sep 23 16:26:35 2022
AnnotationDbi::keytypes(orgdb)## [1] "ACCNUM" "ALIAS" "ENSEMBL" "ENSEMBLPROT" "ENSEMBLTRANS"
## [6] "ENTREZID" "ENZYME" "EVIDENCE" "EVIDENCEALL" "GENENAME"
## [11] "GENETYPE" "GO" "GOALL" "IPI" "MAP"
## [16] "OMIM" "ONTOLOGY" "ONTOLOGYALL" "PATH" "PFAM"
## [21] "PMID" "PROSITE" "REFSEQ" "SYMBOL" "UCSCKG"
## [26] "UNIPROT"
hct.gr <- BioPlex::annotatePFAM(hct.gr, orgdb)Domain-domain association analysis
system.time( res.hct <- BioPlexAnalysis::testDomainAssociation(hct.gr) )## user system elapsed
## 76.688 7.942 86.914
head(res.hct)## PFAM1 PFAM2 FREQ PVAL ADJ.PVAL
## 13871254 PF00227 PF10584 92 1.716339e-177 3.887680e-173
## 2735815 PF00071 PF00996 87 9.549614e-177 1.081542e-172
## 16453714 PF01352 PF14634 114 4.189211e-174 3.162994e-170
## 831958 PF00227 PF00227 105 3.667513e-166 2.076821e-162
## 2192905 PF00735 PF00735 50 3.454425e-144 1.564924e-140
## 3543907 PF00643 PF01352 128 2.873573e-143 1.084822e-139Get human readable description for the PFAM domain IDs:
What are the top interacting domain pairs for the HCT116 network:
res.hct$DOMAIN1 <- id2de[res.hct$PFAM1]
res.hct$DOMAIN2 <- id2de[res.hct$PFAM2]
head(res.hct)
## PFAM1 PFAM2 FREQ PVAL ADJ.PVAL
## 13871254 PF00227 PF10584 92 1.716339e-177 3.887680e-173
## 2735815 PF00071 PF00996 87 9.549614e-177 1.081542e-172
## 16453714 PF01352 PF14634 114 4.189211e-174 3.162994e-170
## 831958 PF00227 PF00227 105 3.667513e-166 2.076821e-162
## 2192905 PF00735 PF00735 50 3.454425e-144 1.564924e-140
## 3543907 PF00643 PF01352 128 2.873573e-143 1.084822e-139
## DOMAIN1
## 13871254 Ets-domain
## 2735815 Myosin head (motor domain)
## 16453714 D-alanyl-D-alanine carboxypeptidase
## 831958 Ets-domain
## 2192905 DNA polymerase family A
## 3543907 Phycobilisome Linker polypeptide
## DOMAIN2
## 13871254 Elongation factor Tu C-terminal domain
## 2735815 TonB dependent receptor
## 16453714 Hemocyanin, all-alpha domain
## 831958 Ets-domain
## 2192905 DNA polymerase family A
## 3543907 D-alanyl-D-alanine carboxypeptidaseVisualization
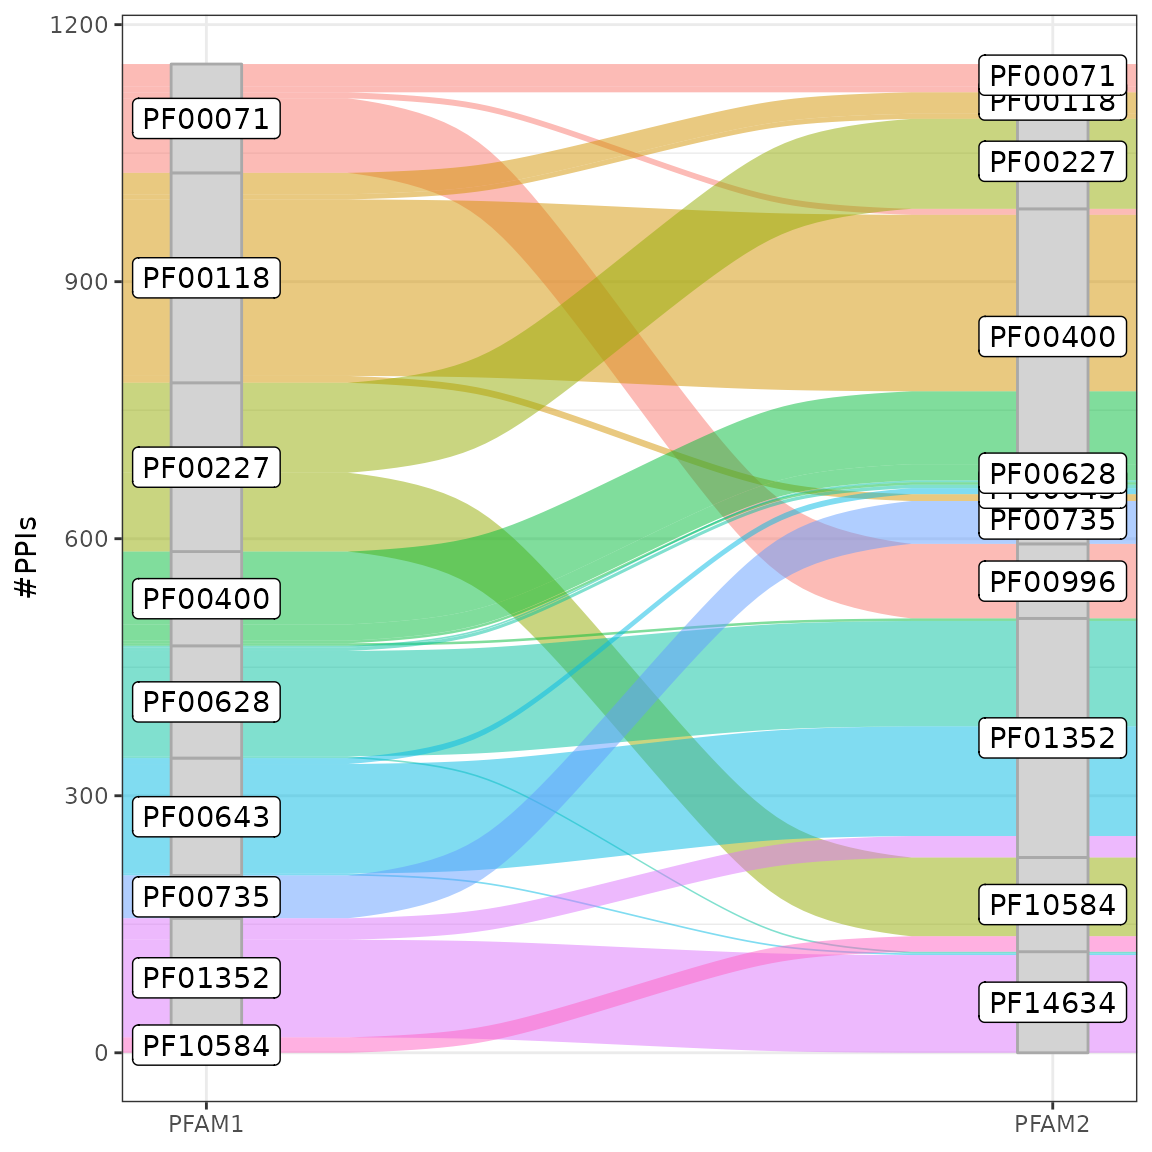
top10 <- unique(c(res.hct[1:8,1], res.hct[1:8,2]))
ind <- res.hct[,1] %in% top10 & res.hct[,2] %in% top10
pldf <- res.hct[ind,]
ggplot(pldf, aes(y = FREQ, axis1 = PFAM1, axis2 = PFAM2)) +
    geom_alluvium(aes(fill = PFAM1)) +
    scale_x_discrete(limits = c("PFAM1", "PFAM2"), expand = c(.05, .05)) +
    geom_stratum(width = 1/12, fill = "lightgrey", color = "darkgrey") +
    geom_label(stat = "stratum", aes(label = after_stat(stratum))) +
    ylab("#PPIs") +
    theme_bw() + theme(legend.position = "none")