Plot a graph
plotGraph.RdPlotting utility for graphs
Arguments
- gr
graph. An object of class
graphNELfrom the graph package.- node.label
character. A node data attribute that is used to label the nodes.
- node.data
character. A node data attribute that is used to overlay on the nodes using different colors.
- edge.data
character. An edge data attribute that is used to overlay on the edges using different line types.
- node.color
character. Default color for the nodes. Is overwritten by
node.dataif not null.- edge.color
character. Default color for the edges.
- edge.mode
character. Whether to display directed or undirected edges.
- layout
character. Circular layout or network layout.
Value
A ggplot.
Examples
library(BioPlex)
corum.df <- getCorum("core")
#> Using cached version from 2023-01-14 23:43:08
corum.glist <- corum2graphlist(corum.df)
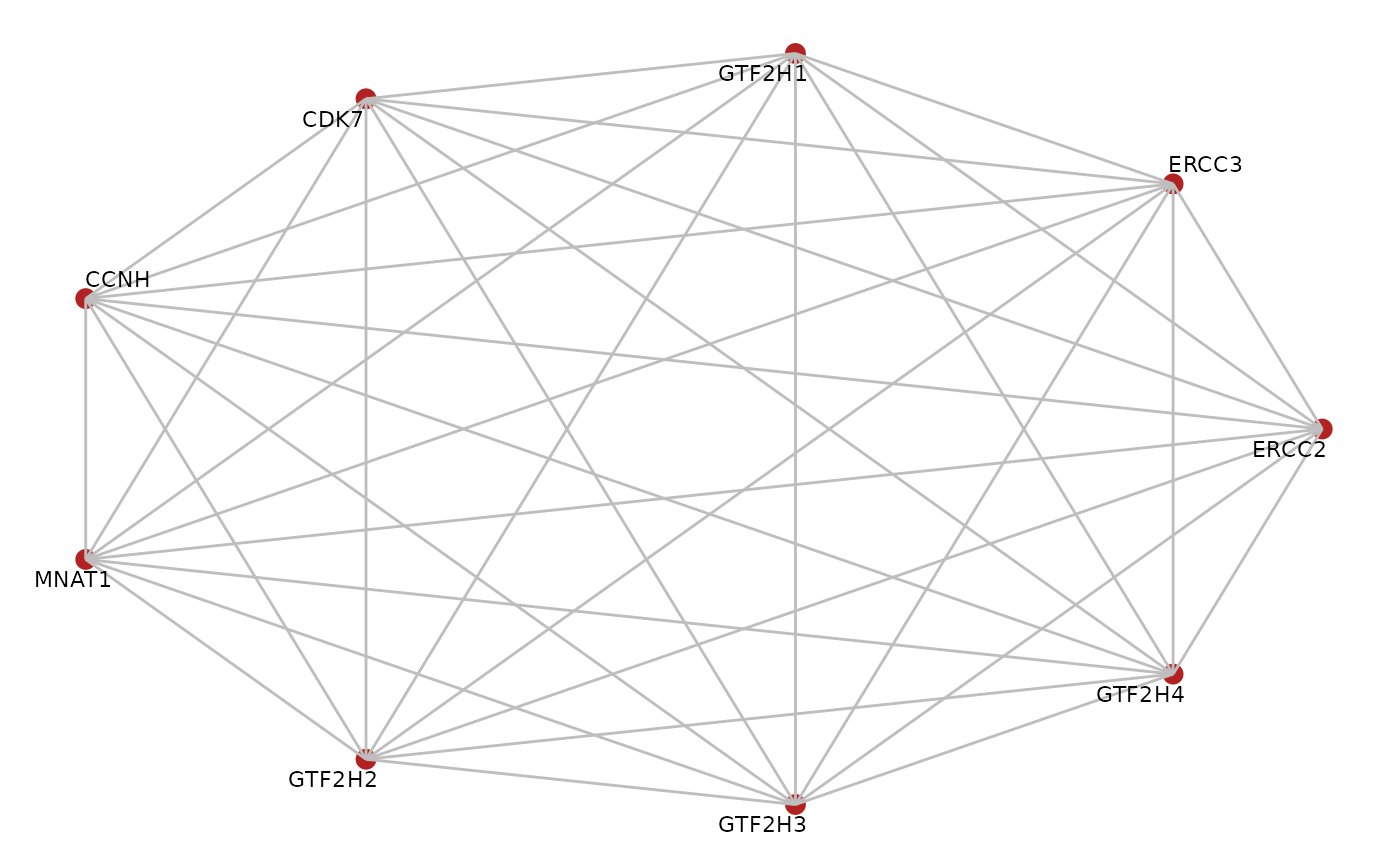
gr <- corum.glist[["CORUM107_TFIIH_transcription_factor_complex"]]
plotGraph(gr, edge.mode = "undirected",
edge.color = "grey", layout = "circle")