This function generates a ggplot2 visualization of principal components (PCs) for different
cell types across two datasets (query and reference), using either boxplots or violin plots.
Usage
boxplotPCA(
  query_data,
  reference_data,
  query_cell_type_col,
  ref_cell_type_col,
  cell_types = NULL,
  pc_subset = 1:5,
  shape = c("box", "violin"),
  assay_name = "logcounts",
  max_cells_query = NULL,
  max_cells_ref = NULL
)
Arguments
- query_data
A
SingleCellExperimentobject containing numeric expression matrix for the query cells.- reference_data
A
SingleCellExperimentobject containing numeric expression matrix for the reference cells.- query_cell_type_col
The column name in the
colDataofquery_datathat identifies the cell types.- ref_cell_type_col
The column name in the
colDataofreference_datathat identifies the cell types.- cell_types
A character vector specifying the cell types to include in the plot. If NULL, all cell types are included.
- pc_subset
A numeric vector specifying which principal components to include in the plot. Default is PC1 to PC5.
- shape
Character string indicating the plot type: "box" for boxplots or "violin" for violin plots. Default is "box".
- assay_name
Name of the assay on which to perform computations. Default is "logcounts".
- max_cells_query
Maximum number of query cells to retain after cell type filtering. If NULL, no downsampling of query cells is performed. Default is NULL.
- max_cells_ref
Maximum number of reference cells to retain after cell type filtering. If NULL, no downsampling of reference cells is performed. Default is NULL.
Value
A ggplot object representing the boxplots or violin plots of specified principal components for the given cell types and datasets.
Details
The function boxplotPCA is designed to provide a visualization of principal component analysis (PCA) results. It projects
the query dataset onto the principal components obtained from the reference dataset. The results are then visualized
as boxplots or violin plots, grouped by cell types and datasets (query and reference). This allows for a comparative analysis of the
distributions of the principal components across different cell types and datasets. The function internally calls projectPCA
to perform the PCA projection. It then reshapes the output data into a long format suitable for ggplot2 plotting.
Author
Anthony Christidis, anthony-alexander_christidis@hms.harvard.edu
Examples
# Load data
data("reference_data")
data("query_data")
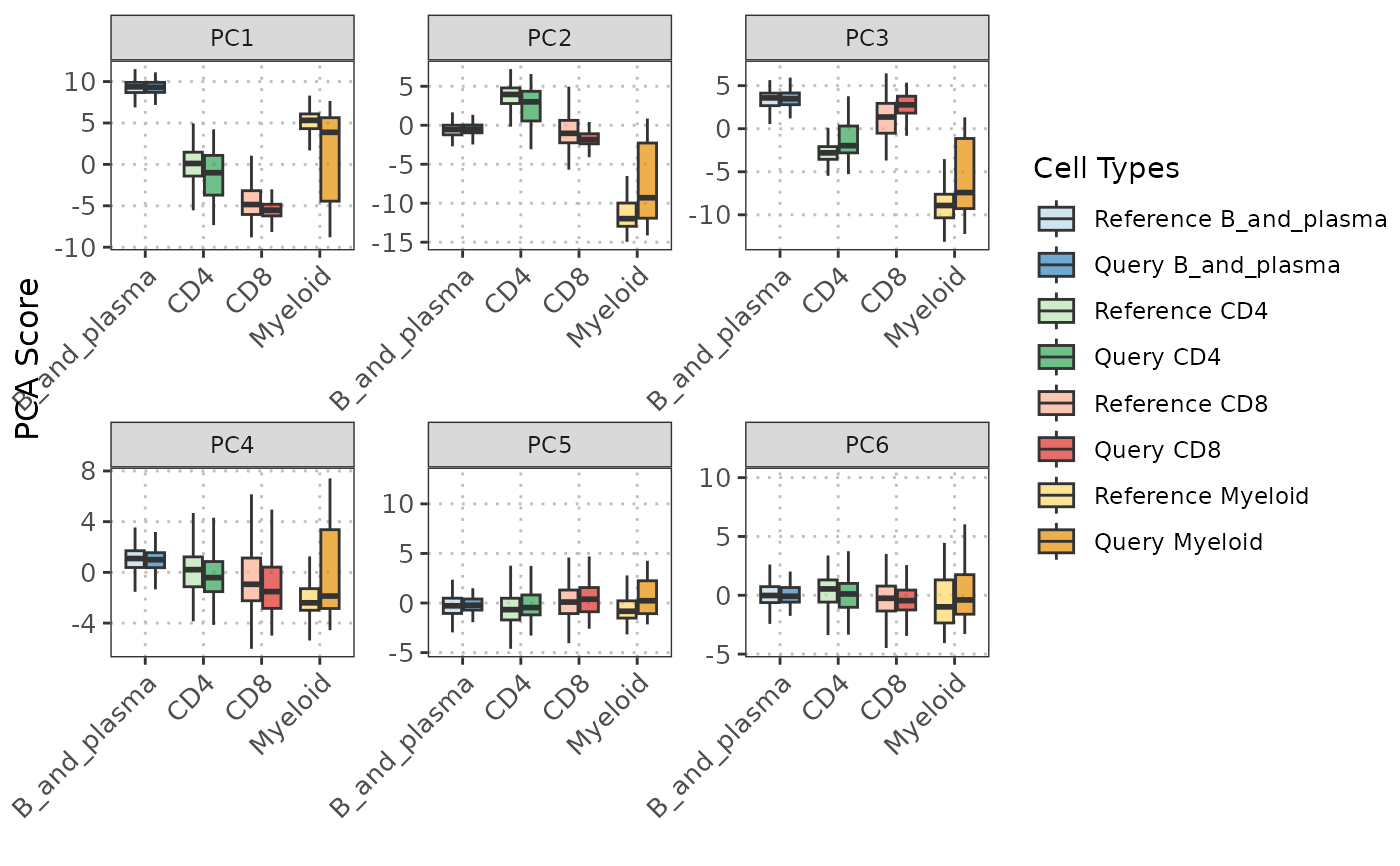
# Plot the PC data with boxplots (default)
pc_plot <- boxplotPCA(query_data = query_data,
reference_data = reference_data,
cell_types = c("CD4", "CD8", "B_and_plasma", "Myeloid"),
query_cell_type_col = "SingleR_annotation",
ref_cell_type_col = "expert_annotation",
pc_subset = 1:6)
pc_plot
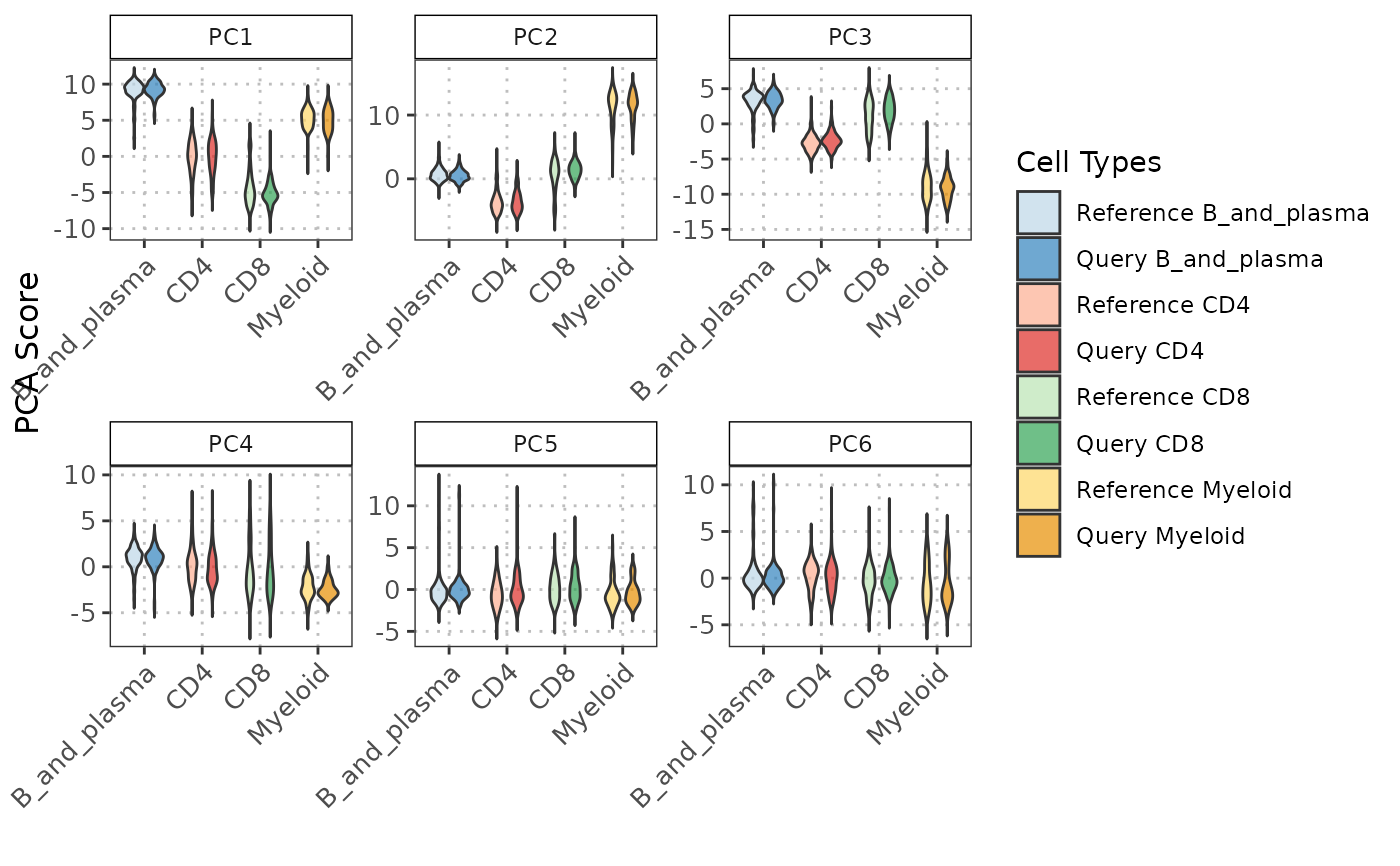
 # Plot the PC data with violin plots
pc_violin <- boxplotPCA(query_data = query_data,
reference_data = reference_data,
cell_types = c("CD4", "CD8", "B_and_plasma", "Myeloid"),
query_cell_type_col = "SingleR_annotation",
ref_cell_type_col = "expert_annotation",
pc_subset = 1:6,
shape = "violin")
pc_violin
# Plot the PC data with violin plots
pc_violin <- boxplotPCA(query_data = query_data,
reference_data = reference_data,
cell_types = c("CD4", "CD8", "B_and_plasma", "Myeloid"),
query_cell_type_col = "SingleR_annotation",
ref_cell_type_col = "expert_annotation",
pc_subset = 1:6,
shape = "violin")
pc_violin