Calculate Nearest Neighbor Diagnostics for Cell Type Classification
Source:R/calculateNearestNeighborProbabilities.R, R/plot.calculateNearestNeighborProbabilitiesObject.R
calculateNearestNeighborProbabilities.RdThis function computes the probabilities for each query cell of belonging to either the reference or query dataset for each cell type using nearest neighbor analysis.
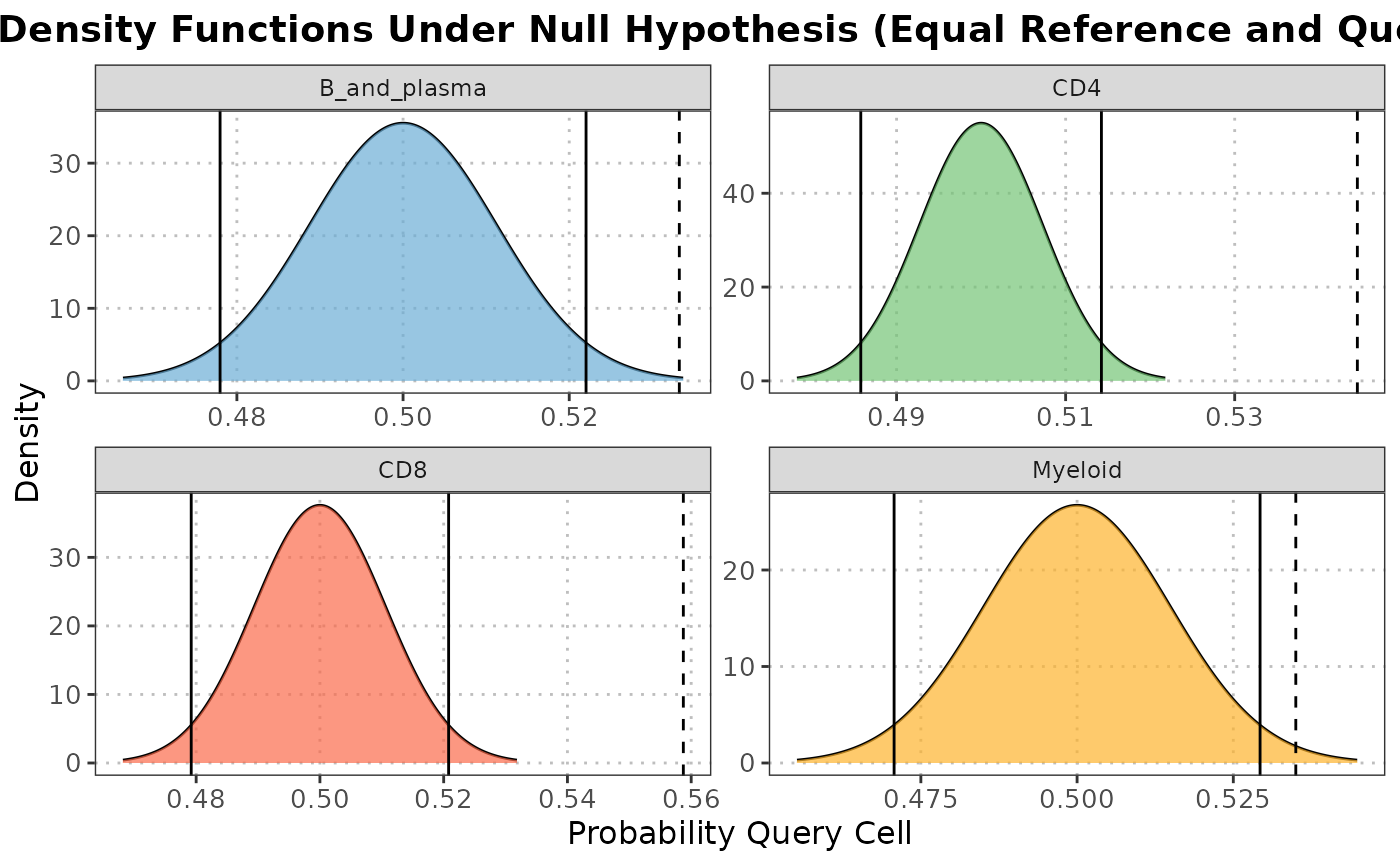
The S3 plot method generates a density plot showing the distribution of probabilities for each cell of belonging to either the reference or query dataset for each cell type.
calculateNearestNeighborProbabilities(
  query_data,
  reference_data,
  query_cell_type_col,
  ref_cell_type_col,
  cell_types = NULL,
  pc_subset = 1:5,
  n_neighbor = 20,
  assay_name = "logcounts"
)

# S3 method for class 'calculateNearestNeighborProbabilitiesObject'
plot(x, cell_types = NULL, ...)
Arguments
- query_data
A
SingleCellExperimentobject containing numeric expression matrix for the query cells.- reference_data
A
SingleCellExperimentobject containing numeric expression matrix for the reference cells.- query_cell_type_col
A character string specifying the column name in the query dataset containing cell type annotations.
- ref_cell_type_col
A character string specifying the column name in the reference dataset containing cell type annotations.
- cell_types
A character vector specifying the cell types to include in the plot. If NULL, all cell types in
xwill be plotted. Default is NULL.- pc_subset
A vector specifying the subset of principal components to use in the analysis. Default is 1:5
- n_neighbor
An integer specifying the number of nearest neighbors to consider. Default is 20.
- assay_name
Name of the assay on which to perform computations. Default is "logcounts".
- x
An object of class
nearestNeighbotDiagnosticscontaining the probabilities calculated by thecalculateNearestNeighborProbabilitiesfunction.- ...
Additional arguments to be passed to
geom_density.
Value
A list where each element corresponds to a cell type and contains:
- n_neighbor
The number of nearest neighbors considered.
- n_query
The number of cells in the query dataset for each cell type.
- query_prob
The average probability of each query cell belonging to the reference dataset.
The list is assigned the class "calculateNearestNeighborProbabilities".
Each element in the list is named after the respective cell type.
The S3 plot method returns a ggplot density plot.
Details
The function conducts PCA on both the query and reference datasets to reduce dimensionality. It then compares each query cell to its nearest neighbors in the reference dataset to estimate the probability of membership in each cell type. Sample sizes between datasets are balanced using data augmentation if necessary.
The S3 plot method creates a density plot to visualize the distribution of probabilities for each cell belonging to the reference or query dataset for each cell type. It utilizes the ggplot2 package for plotting.
See also
plot.calculateNearestNeighborProbabilitiesObject
calculateNearestNeighborProbabilities
Examples
# Load data
data("reference_data")
data("query_data")

# Project the query data onto PCA space of reference
nn_output <- calculateNearestNeighborProbabilities(query_data = query_data,
                                                   reference_data = reference_data,
                                                   query_cell_type_col = "SingleR_annotation",
                                                   ref_cell_type_col = "expert_annotation",
                                                   pc_subset = 1:10,
                                                   n_neighbor = 20)

# Plot output
plot(nn_output, cell_types = c("CD4", "CD8", "B_and_plasma", "Myeloid"))