Compute Wasserstein Distance Distributions Between Query and Reference Datasets
Source:R/calculateWassersteinDistance.R, R/plot.calculateWassersteinDistanceObject.R
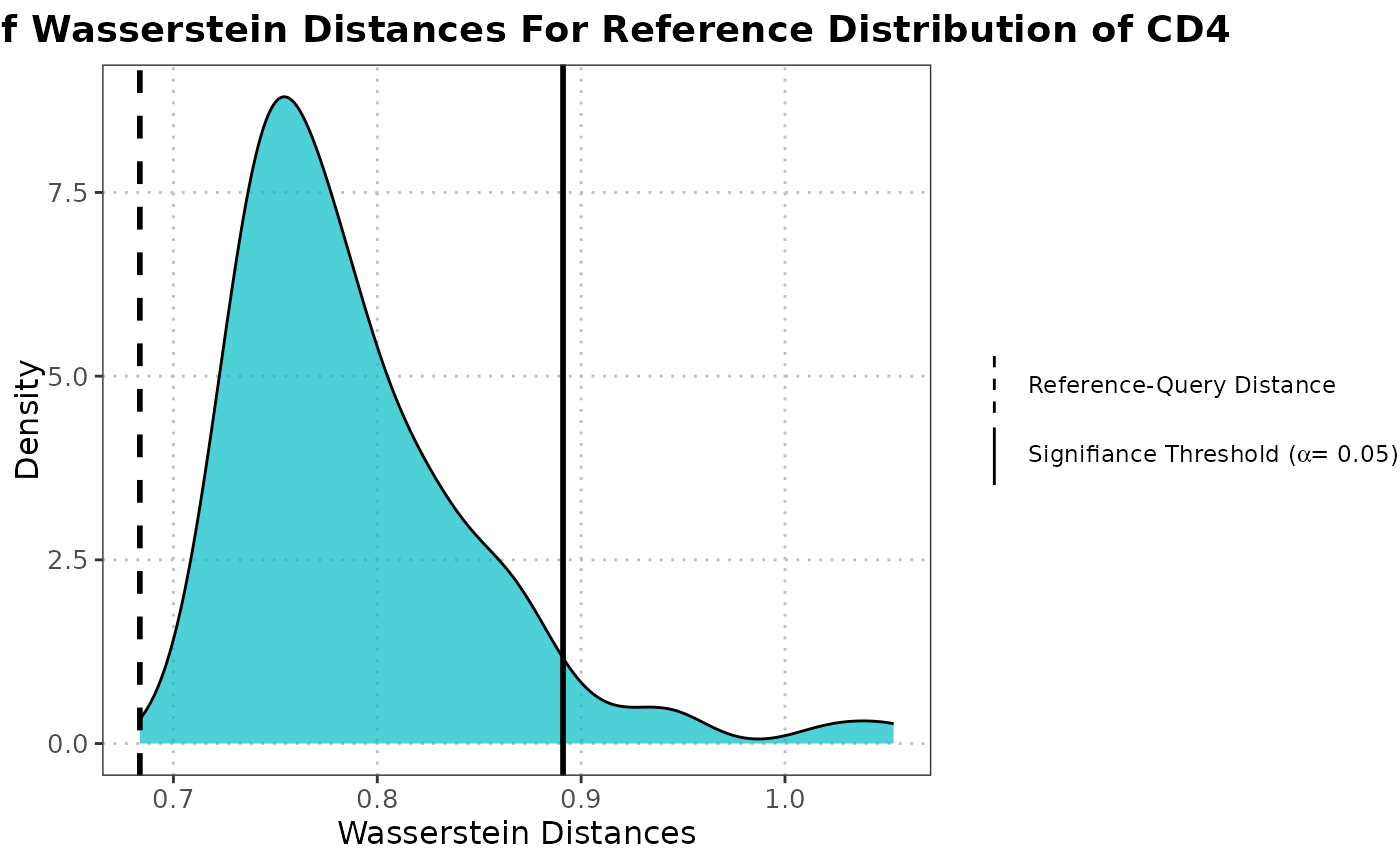
calculateWassersteinDistance.RdThis function calculates distributions of Wasserstein distances between reference-reference pairs and reference-query pairs for each specified cell type, after projecting them into a shared PCA space. It then computes the probability of superiority to assess whether reference-query distances tend to be larger than reference-reference distances.
This function generates ridge plots comparing reference-reference and reference-query Wasserstein distance distributions for each cell type.
Usage
calculateWassersteinDistance(
  query_data,
  reference_data,
  ref_cell_type_col,
  query_cell_type_col,
  cell_types = NULL,
  pc_subset = 1:5,
  n_resamples = 300,
  assay_name = "logcounts",
  max_cells_query = 5000,
  max_cells_ref = 5000
)

# S3 method for class 'calculateWassersteinDistanceObject'
plot(x, cell_types = NULL, bandwidth = NULL, ...)
Arguments
- query_data
A
SingleCellExperimentobject containing a numeric expression matrix for the query cells.- reference_data
A
SingleCellExperimentobject with a numeric expression matrix for the reference cells.- ref_cell_type_col
The column name in the
colDataofreference_datathat identifies cell types.- query_cell_type_col
The column name in the
colDataofquery_datathat identifies cell types.- cell_types
A character vector specifying which cell types to plot. If NULL, all cell types are plotted.
- pc_subset
A numeric vector specifying which principal components to use. Default is
1:5.- n_resamples
An integer specifying the number of resamples to generate each distribution. Default is
300.- assay_name
The name of the assay to use for computations. Default is
"logcounts".- max_cells_query
Maximum number of query cells to retain after cell type filtering. If NULL, no downsampling of query cells is performed. Default is 5000.
- max_cells_ref
Maximum number of reference cells to retain after cell type filtering. If NULL, no downsampling of reference cells is performed. Default is 5000.
- x
A list object containing the Wasserstein distance results from the
calculateWassersteinDistancefunction.- bandwidth
A numeric value specifying the bandwidth for density estimation. If NULL (default), automatic bandwidth selection is used.
- ...
Additional arguments for future extensions.
Value
A list with the following components:
- ref_ref_dist
A named list of numeric vectors containing Wasserstein distances computed from resampled pairs within the reference dataset for each cell type.
- ref_query_dist
A named list of numeric vectors containing Wasserstein distances between reference and query datasets for each cell type.
- probability_superiority
A named numeric vector showing the probability that ref-query distances are larger than ref-ref distances for each cell type.
- cell_types
A character vector containing the cell types analyzed.
A ggplot2 object representing the comparison of Wasserstein distance distributions.
Details
The function projects the query dataset onto the PCA space defined by the reference dataset. For each cell type, it computes two distributions: (1) Wasserstein distances between randomly sampled pairs within the reference dataset (null distribution), and (2) Wasserstein distances between reference and query dataset samples. It then calculates the probability of superiority, which represents the probability that a randomly selected ref-query distance is larger than a randomly selected ref-ref distance.
The function creates faceted ridge plots showing two clearly separated density curves for each cell type: one for the reference-reference distribution (null) and one for the reference-query distribution.
References
Schuhmacher, D., Bernhard, S., & Book, M. (2019). "A Review of Approximate Transport in Machine Learning". In Journal of Machine Learning Research (Vol. 20, No. 117, pp. 1-61).
Author
Anthony Christidis, anthony-alexander_christidis@hms.harvard.edu
Examples
# Load data
data("reference_data")
data("query_data")

# Compute Wasserstein distance distributions for all cell types
wasserstein_data <- calculateWassersteinDistance(query_data = query_data,
                                                 reference_data = reference_data,
                                                 query_cell_type_col = "expert_annotation",
                                                 ref_cell_type_col = "expert_annotation",
                                                 pc_subset = 1:5,
                                                 n_resamples = 100)
plot(wasserstein_data)
#> Picking joint bandwidth of 0.0188
#> Picking joint bandwidth of 0.0149
#> Picking joint bandwidth of 0.0153
#> Picking joint bandwidth of 0.0326