Histograms: QC Stats and Annotation Scores Visualization
Source:R/histQCvsAnnotation.R
histQCvsAnnotation.RdThis function generates histograms for visualizing the distribution of quality control (QC) statistics and annotation scores associated with cell types in single-cell genomic data.
Usage
histQCvsAnnotation(
  sce_object,
  cell_type_col,
  cell_types = NULL,
  qc_col,
  score_col,
  max_cells = NULL
)
Arguments
- sce_object
A
SingleCellExperimentcontaining the single-cell expression data and metadata.- cell_type_col
The column name in the
colDataofsce_objectthat contains the cell type labels.- cell_types
A vector of cell types to plot (e.g., c("T-cell", "B-cell")). Defaults to
NULL, which will include all the cells.- qc_col
A column name in the
colDataofsce_objectthat contains the QC stats of interest.- score_col
The column name in the
colDataofsce_objectthat contains the cell type scores.- max_cells
Maximum number of cells to retain. If the object has fewer cells, it is returned unchanged. Default is NULL.
Value
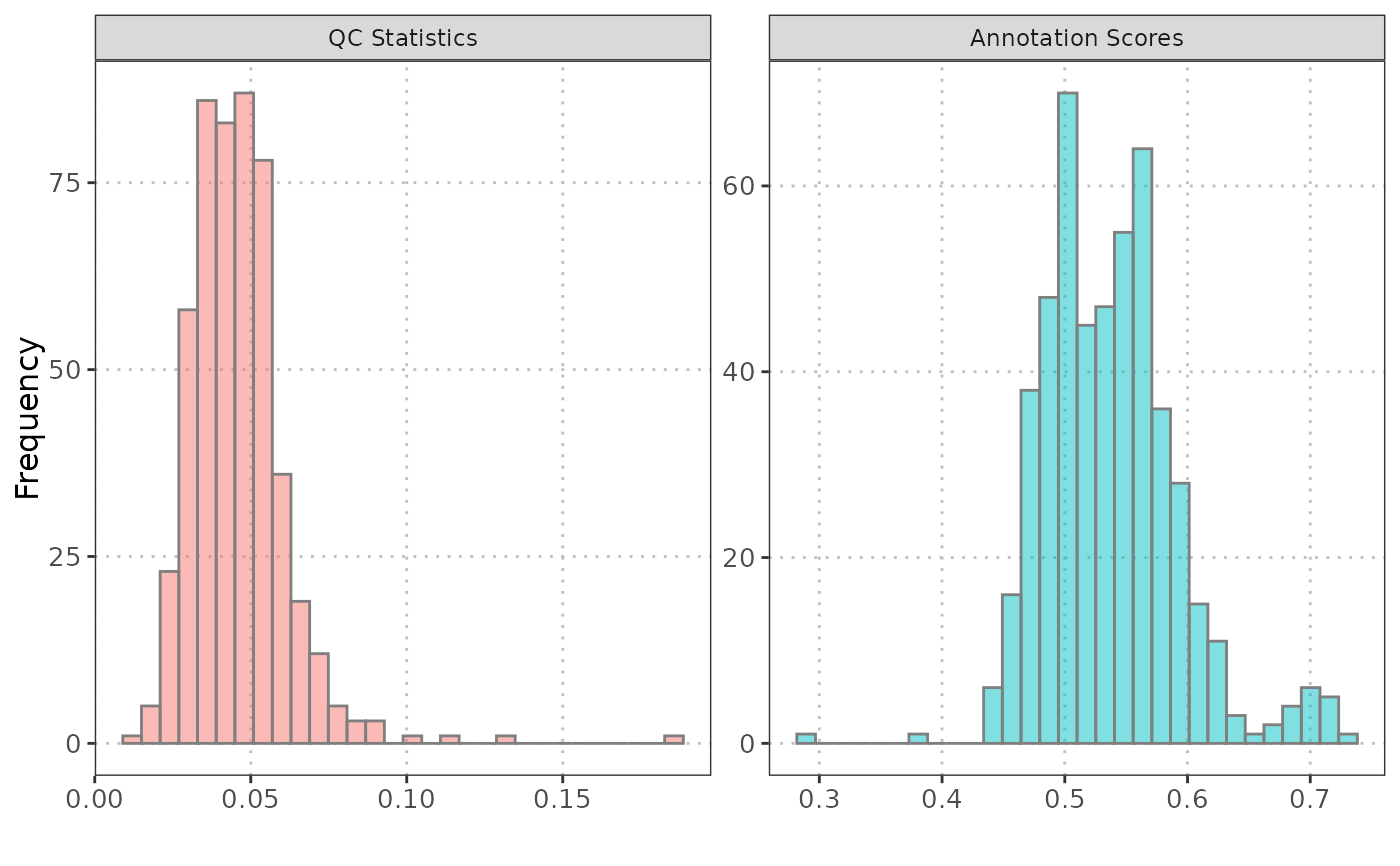
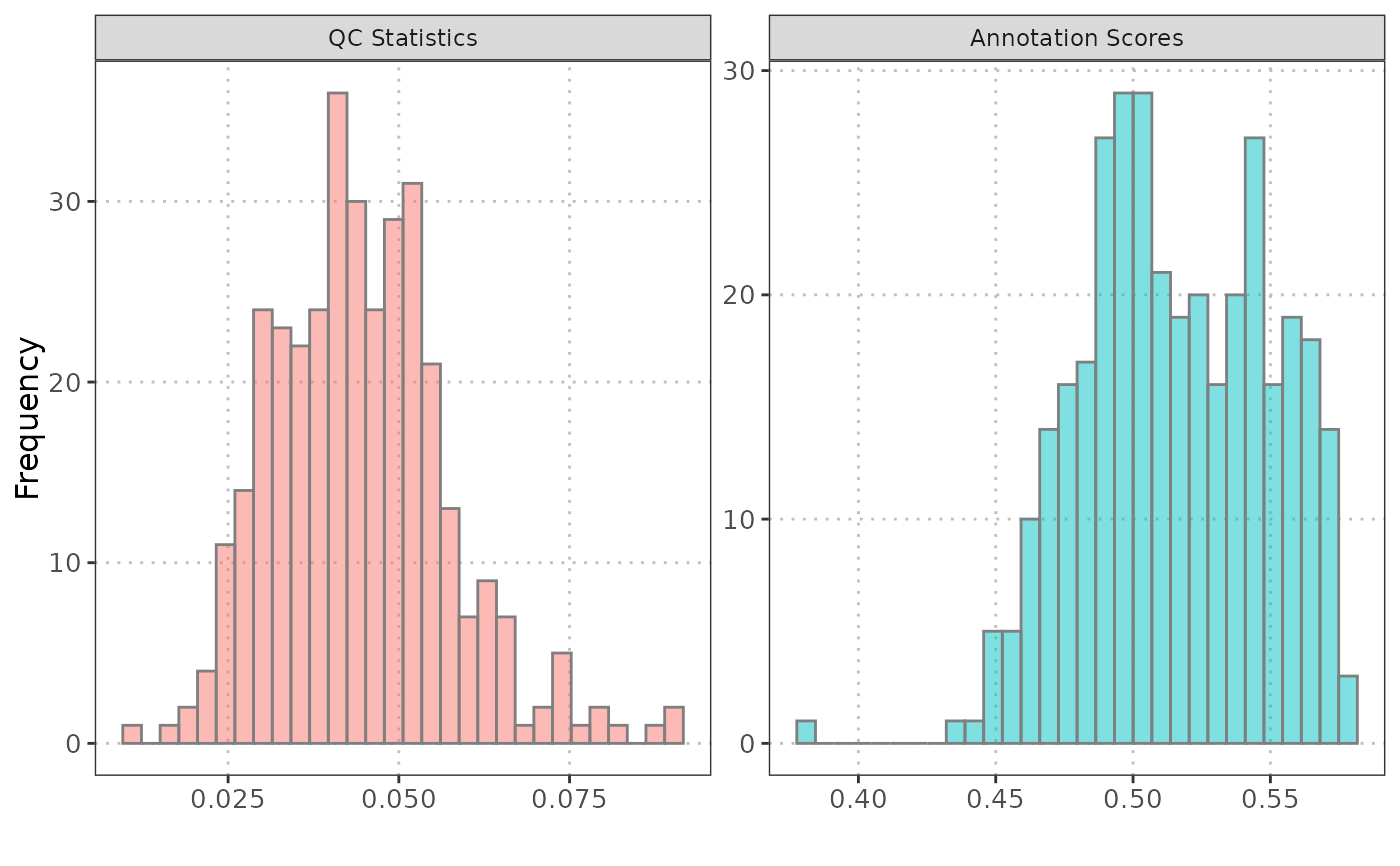
A object containing two histograms displayed side by side. The first histogram represents the distribution of QC stats, and the second histogram represents the distribution of annotation scores.
Details
The particularly useful in the analysis of data from single-cell experiments, where understanding the distribution of these metrics is crucial for quality assessment and interpretation of cell type annotations.
Examples
data("query_data")

# Generate histograms
histQCvsAnnotation(sce_object = query_data,
                   cell_type_col = "SingleR_annotation",
                   cell_types = c("CD4", "CD8"),
                   qc_col = "percent_mito",
                   score_col = "annotation_scores")


histQCvsAnnotation(sce_object = query_data,
                   cell_type_col = "SingleR_annotation",
                   cell_types = NULL,
                   qc_col = "percent_mito",
                   score_col = "annotation_scores")
histQCvsAnnotation(sce_object = query_data,
cell_type_col = "SingleR_annotation",
cell_types = NULL,
qc_col = "percent_mito",
score_col = "annotation_scores")