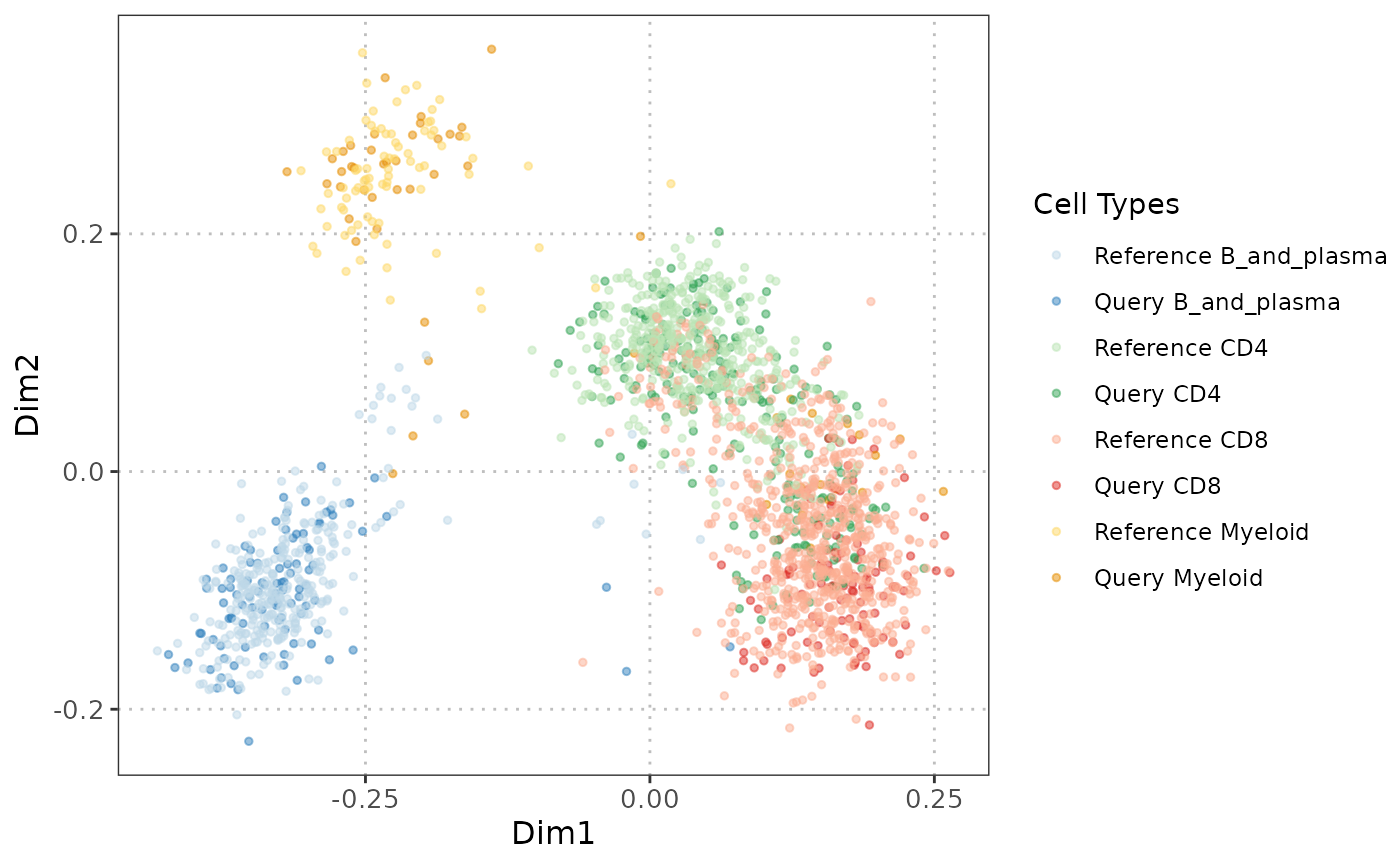
This function facilitates the assessment of similarity between reference and query datasets through Multidimensional Scaling (MDS) scatter plots. It allows the visualization of cell types, color-coded with user-defined custom colors, based on a dissimilarity matrix computed from a user-selected gene set. If MDS coordinates are precomputed in reducedDims, they will be used; otherwise, MDS will be computed from scratch.
Usage
plotCellTypeMDS(
  query_data,
  reference_data,
  query_cell_type_col,
  ref_cell_type_col,
  cell_types = NULL,
  assay_name = "logcounts",
  max_cells_query = 5000,
  max_cells_ref = 5000
)
Arguments
- query_data
A
SingleCellExperimentcontaining the single-cell expression data and metadata.- reference_data
A
SingleCellExperimentobject containing the single-cell expression data and metadata.- query_cell_type_col
The column name in the
colDataofquery_datathat identifies the cell types.- ref_cell_type_col
The column name in the
colDataofreference_datathat identifies the cell types.- cell_types
A character vector specifying the cell types to include in the plot. If NULL, all cell types are included.
- assay_name
Name of the assay on which to perform computations. Default is "logcounts".
- max_cells_query
Maximum number of query cells to retain after cell type filtering. If NULL, no downsampling of query cells is performed. Default is 5000.
- max_cells_ref
Maximum number of reference cells to retain after cell type filtering. If NULL, no downsampling of reference cells is performed. Default is 5000.
Details
The function first checks if MDS coordinates are available in the reducedDims of both datasets. If precomputed MDS is found, it uses those coordinates directly for visualization.
If MDS is not precomputed, the function selects specific subsets of cells from both reference and query datasets. It then calculates Spearman correlations between gene expression profiles, deriving a dissimilarity matrix. This matrix undergoes Classical Multidimensional Scaling (MDS) for visualization, presenting cell types in a scatter plot, distinguished by colors defined by the user.
References
Kruskal, J. B. (1964). "Multidimensional scaling by optimizing goodness of fit to a nonmetric hypothesis". *Psychometrika*, 29(1), 1-27. doi:10.1007/BF02289565.
Borg, I., & Groenen, P. J. F. (2005). *Modern multidimensional scaling: Theory and applications* (2nd ed.). Springer Science & Business Media. doi:10.1007/978-0-387-25975-1.
Author
Anthony Christidis, anthony-alexander_christidis@hms.harvard.edu
Examples
# Load data
data("reference_data")
data("query_data")

# Generate the MDS scatter plot with cell type coloring
mds_plot <- plotCellTypeMDS(query_data = query_data,
                            reference_data = reference_data,
                            cell_types = c("CD4", "CD8", "B_and_plasma", "Myeloid")[1:4],
                            query_cell_type_col = "SingleR_annotation",
                            ref_cell_type_col = "expert_annotation")
#> Computing MDS from expression data.
mds_plot