Visualize gene expression on a dimensional reduction plot
Source:R/plotGeneExpressionDimred.R
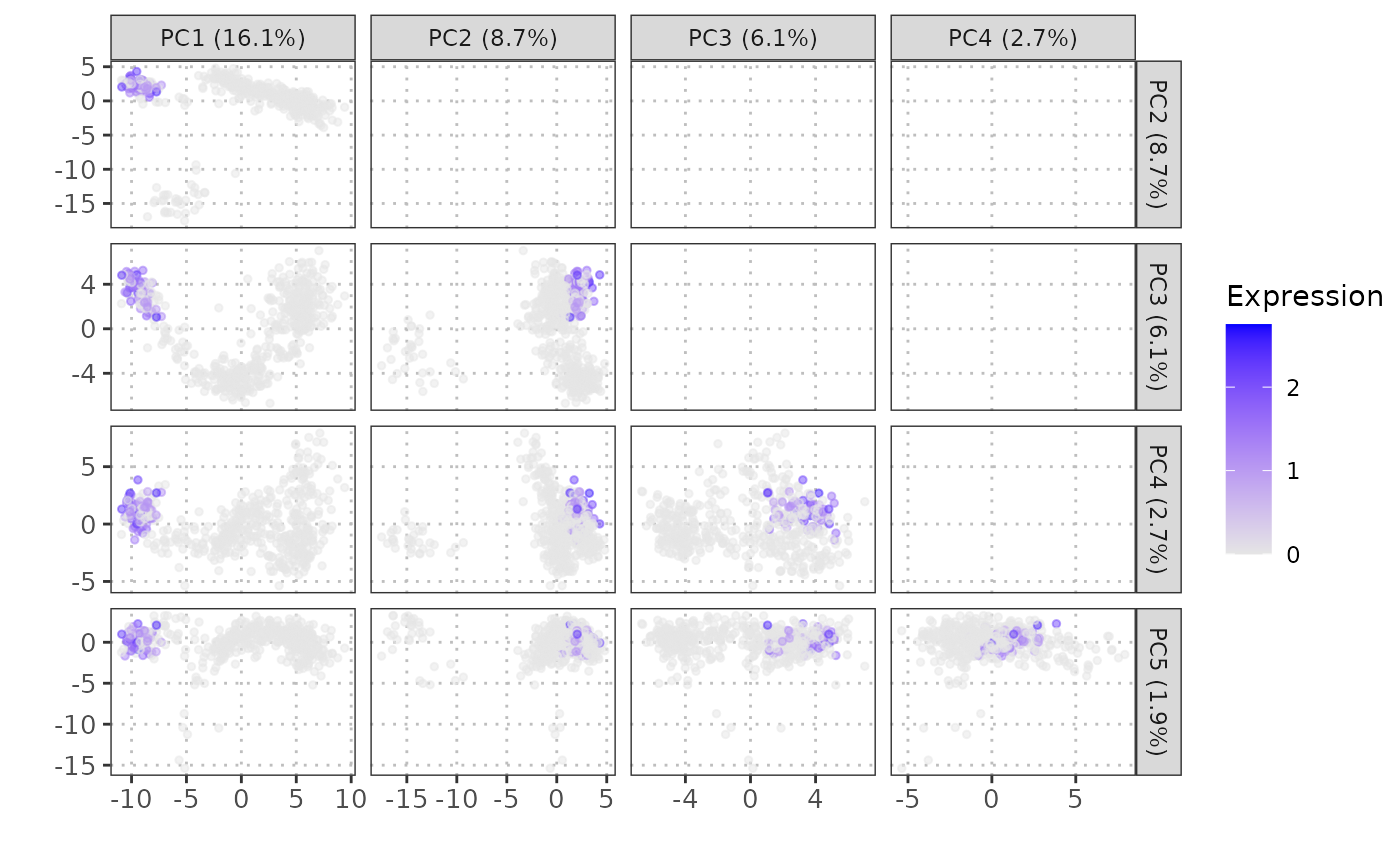
plotGeneExpressionDimred.RdThis function plots gene expression on a dimensional reduction plot using methods like t-SNE, UMAP, or PCA. Each single cell is color-coded based on the expression of a specific gene or feature.
Usage
plotGeneExpressionDimred(
  sce_object,
  method = c("TSNE", "UMAP", "PCA"),
  pc_subset = 1:5,
  feature,
  cell_type_col,
  cell_types = NULL,
  assay_name = "logcounts",
  max_cells = 2000
)
Arguments
- sce_object
An object of class
SingleCellExperimentcontaining log-transformed expression matrix and other metadata. It can be either a reference or query dataset.- method
The reduction method to use for visualization. It should be one of the supported methods: "TSNE", "UMAP", or "PCA".
- pc_subset
An optional vector specifying the principal components (PCs) to include in the plot if method = "PCA". Default is 1:5.
- feature
A character string representing the name of the gene or feature to be visualized.
- cell_type_col
The column name in the
colDataofsce_objectthat identifies the cell types.- cell_types
A character vector specifying the cell types to include in the plot. If NULL, all cell types are included.
- assay_name
Name of the assay on which to perform computations. Default is "logcounts".
- max_cells
Maximum number of cells to retain. If the object has fewer cells, it is returned unchanged. Default is 2000.
Examples
# Load data
data("query_data")

# Plot gene expression on PCA plot
plotGeneExpressionDimred(sce_object = query_data,
                         cell_type_col = "SingleR_annotation",
                         method = "PCA",
                         pc_subset = 1:5,
                         feature = "CD8A",
                         cell_types = "CD4")