Plot gene expression distribution from overall and cell type-specific perspective
Source:R/plotMarkerExpression.R
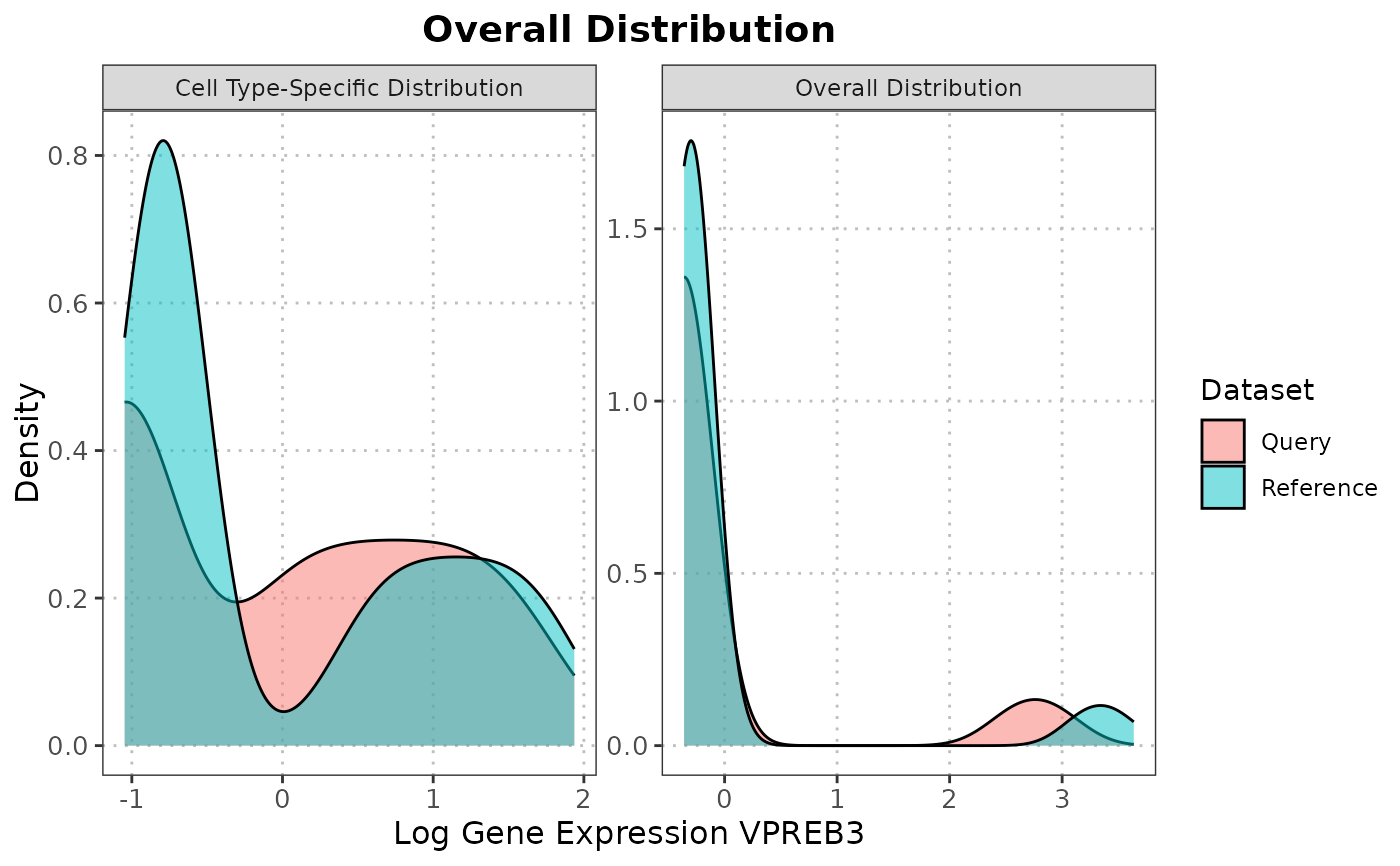
plotMarkerExpression.RdThis function generates density plots to visualize the distribution of gene expression values for a specific gene across the overall dataset and within a specified cell type.
Usage
plotMarkerExpression(
  query_data,
  reference_data,
  ref_cell_type_col,
  query_cell_type_col,
  cell_type,
  gene_name,
  assay_name = "logcounts",
  normalization = c("z_score", "min_max", "rank", "none"),
  max_cells_query = NULL,
  max_cells_ref = NULL
)
Arguments
- query_data
A
SingleCellExperimentobject containing numeric expression matrix for the query cells.- reference_data
A
SingleCellExperimentobject containing numeric expression matrix for the reference cells.- ref_cell_type_col
The column name in the
colDataofreference_datathat identifies the cell types.- query_cell_type_col
The column name in the
colDataofquery_datathat identifies the cell types.- cell_type
A cell type to plot (e.g., c("T-cell", "B-cell")).
- gene_name
The gene name for which the distribution is to be visualized.
- assay_name
Name of the assay on which to perform computations. Default is "logcounts".
- normalization
Method for normalizing expression values. Options: "z_score" (default), "min_max", "rank", "none".
- max_cells_query
Maximum number of query cells to retain after cell type filtering. If NULL, no downsampling of query cells is performed. Default is NULL.
- max_cells_ref
Maximum number of reference cells to retain after cell type filtering. If NULL, no downsampling of reference cells is performed. Default is NULL.
Details
This function generates density plots to compare the distribution of a specific marker gene between reference and query datasets. The aim is to inspect the alignment of gene expression levels as a surrogate for dataset similarity. Similar distributions suggest a good alignment, while differences may indicate discrepancies or incompatibilities between the datasets.
Multiple normalization options are available: - "z_score": Standard z-score normalization within each dataset - "min_max": Min-max scaling to [0,1] range within each dataset - "rank": Maps values to quantile ranks (0-100 scale) - "none": No transformation (preserves original scale differences)
Author
Anthony Christidis, anthony-alexander_christidis@hms.harvard.edu
Examples
# Load data
data("reference_data")
data("query_data")

# Note: Users can use SingleR or any other method to obtain the cell type annotations.
plotMarkerExpression(reference_data = reference_data,
                     query_data = query_data,
                     ref_cell_type_col = "expert_annotation",
                     query_cell_type_col = c("expert_annotation", "SingleR_annotation")[1],
                     gene_name = "CD8A",
                     cell_type = "CD4",
                     normalization = "z_score")
#> Picking joint bandwidth of 0.303
#> Picking joint bandwidth of 0.234