Ridgeline Plot of Pairwise Distance Analysis
Source:R/plotPairwiseDistancesDensity.R
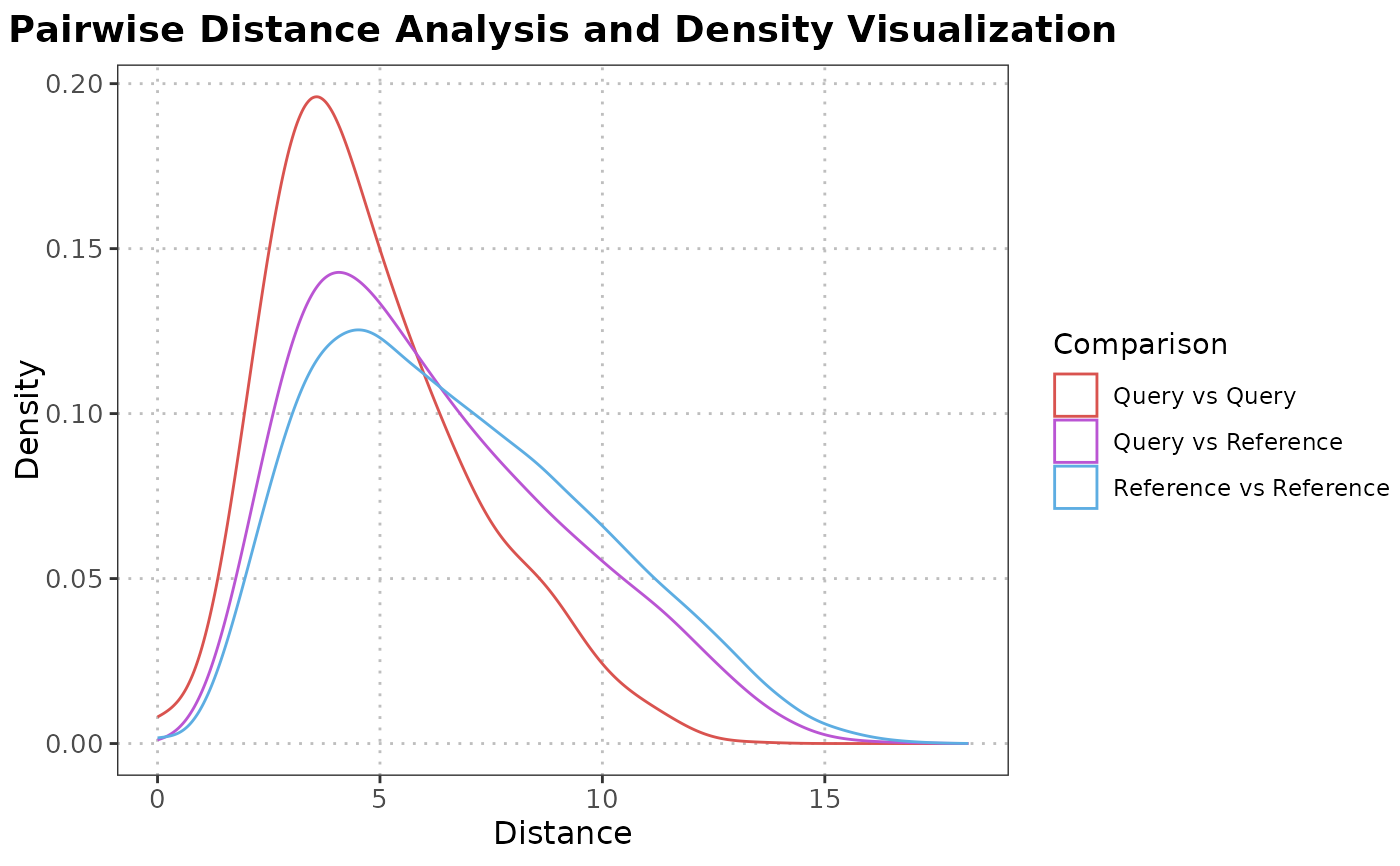
plotPairwiseDistancesDensity.RdThis function calculates pairwise distances or correlations between query and reference cells of a specified cell type and visualizes the results using ridgeline plots, displaying the density distribution for each comparison.
Usage
plotPairwiseDistancesDensity(
  query_data,
  reference_data,
  query_cell_type_col,
  ref_cell_type_col,
  cell_type,
  pc_subset = 1:5,
  distance_metric = c("correlation", "euclidean"),
  correlation_method = c("spearman", "pearson"),
  bandwidth = 0.25,
  assay_name = "logcounts",
  max_cells_query = 5000,
  max_cells_ref = 5000
)
Arguments
- query_data
A
SingleCellExperimentcontaining the single-cell expression data and metadata.- reference_data
A
SingleCellExperimentobject containing the single-cell expression data and metadata.- query_cell_type_col
The column name in the
colDataofquery_datathat identifies the cell types.- ref_cell_type_col
The column name in the
colDataofreference_datathat identifies the cell types.- cell_type
The cell type for which distances or correlations are calculated.
- pc_subset
A numeric vector specifying which principal components to use in the analysis. Default is 1:5. If set to
NULL, the assay data is used directly for computations without dimensionality reduction.- distance_metric
The distance metric to use for calculating pairwise distances, such as euclidean, manhattan, etc. Set to "correlation" to calculate correlation coefficients.
- correlation_method
The correlation method to use when
distance_metricis "correlation". Possible values are "pearson" and "spearman".- bandwidth
Numeric value controlling the smoothness of the density estimate; smaller values create more detailed curves. Default is 0.25.
- assay_name
Name of the assay on which to perform computations. Default is "logcounts".
- max_cells_query
Maximum number of query cells to retain after cell type filtering. If NULL, no downsampling of query cells is performed. Default is 5000.
- max_cells_ref
Maximum number of reference cells to retain after cell type filtering. If NULL, no downsampling of reference cells is performed. Default is 5000.
Details
Designed for SingleCellExperiment objects, this function subsets data for the specified cell type,
computes pairwise distances or correlations, and visualizes these measurements through ridgeline plots.
The plots help evaluate the consistency and differentiation of annotated cell types within single-cell datasets.
Examples
# Load data
data("reference_data")
data("query_data")

# Example usage of the function
plotPairwiseDistancesDensity(query_data = query_data,
                             reference_data = reference_data,
                             query_cell_type_col = "SingleR_annotation",
                             ref_cell_type_col = "expert_annotation",
                             cell_type = "CD8",
                             pc_subset = 1:5,
                             distance_metric = "euclidean",
                             correlation_method = "pearson")