You can find the original, extended version of this chapter here.
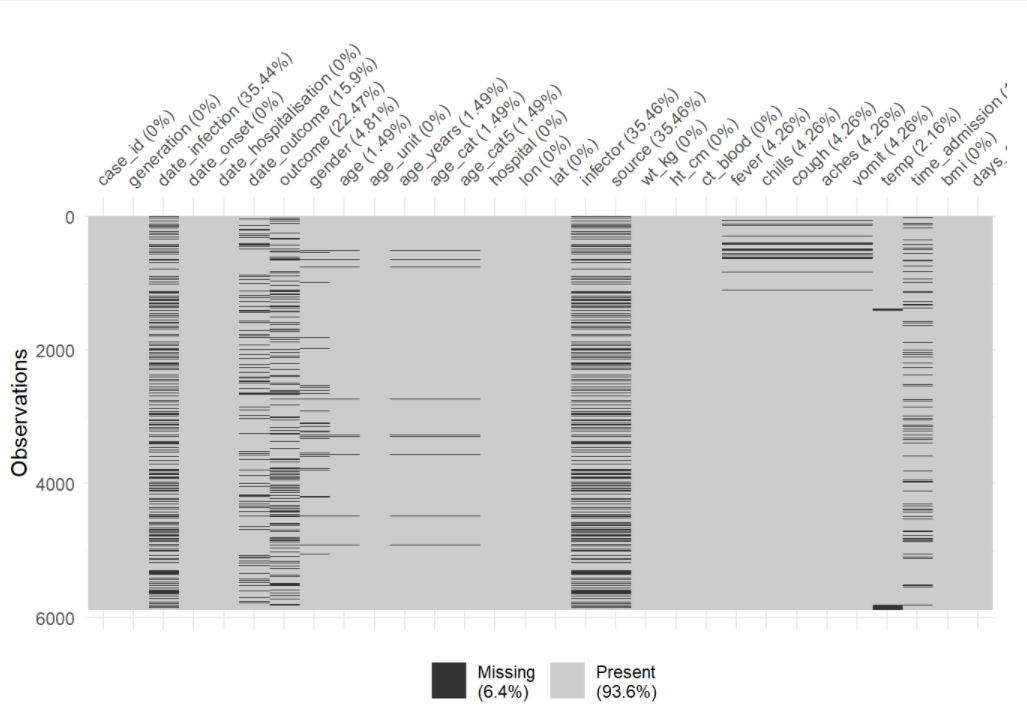
This chapter will cover how to assess missingness, filter out rows by missingness, and handle how NA is displayed in plots.
Below we explore ways that missingness is presented and assessed in R, along with some adjacent values and functions.
NAIn R, missing values are represented by a reserved (special) value - NA. Note that this is typed without quotes. “NA” is different and is just a normal character value (also a Beatles lyric from the song Hey Jude).
Your data may have other ways of representing missingness, such as “99”, or “Missing”, or “Unknown” - you may even have empty character value “” which looks “blank”, or a single space ” “. Be aware of these and consider whether to convert them to NA during import or during data cleaning with na_if().
In your data cleaning, you may also want to convert the other way - changing all NA to “Missing” or similar with replace_na() or with fct_explicit_na() for factors.
NAMost of the time, NA represents a missing value and everything works fine. However, in some circumstances you may encounter the need for variations of NA specific to an object class (character, numeric, etc). This will be rare, but you should be aware.
The typical scenario for this is when creating a new column with the dplyr function case_when(). This function evaluates every row in the data frame, assess whether the rows meets specified logical criteria (right side of the code), and assigns the correct new value (left side of the code). Importantly: all values on the right side must be the same class.
linelist <- linelist %>%

  # Create new "age_years" column from "age" column
  mutate(age_years = case_when(
    age_unit == "years"  ~ age,       # if age is given in years, assign original value
    age_unit == "months" ~ age/12,    # if age is given in months, divide by 12
    is.na(age_unit)      ~ age,       # if age UNIT is missing, assume years
    TRUE                 ~ NA_real_)) # any other circumstance, assign missing
If you want NA on the right side, you may need to specify one of the special NA options listed below. If the other right side values are character, consider using “Missing” instead or otherwise use NA_character_. If they are all numeric, use NA_real_. If they are all dates or logical, you can use NA.
NA - use for dates or logical TRUE/FALSENA_character_ - use for charactersNA_real_ - use for numericAgain, it is not likely you will encounter these variations unless you are using case_when() to create a new column. See the R documentation on NA for more information.
NULLNULL is another reserved value in R. It is the logical representation of a statement that is neither true nor false. It is returned by expressions or functions whose values are undefined. Generally do not assign NULL as a value, unless writing functions or perhaps writing a [shiny app][Dashboards with Shiny] to return NULL in specific scenarios.
Null-ness can be assessed using is.null() and conversion can made with as.null().
See this blog post on the difference between NULL and NA.
NaNImpossible values are represented by the special value NaN. An example of this is when you force R to divide 0 by 0. You can assess this with is.nan(). You may also encounter complementary functions including is.infinite() and is.finite().
InfInf represents an infinite value, such as when you divide a number by 0.
As an example of how this might impact your work: let’s say you have a vector/column z that contains these values: z <- c(1, 22, NA, Inf, NaN, 5)
If you want to use max() on the column to find the highest value, you can use the na.rm = TRUE to remove the NA from the calculation, but the Inf and NaN remain and Inf will be returned. To resolve this, you can use brackets [ ] and is.finite() to subset such that only finite values are used for the calculation: max(z[is.finite(z)]).
z <- c(1, 22, NA, Inf, NaN, 5)
max(z)                           # returns NA
max(z, na.rm=T)                  # returns Inf
max(z[is.finite(z)]) # returns 22| R command | Outcome |
|---|---|
5 / 0 |
Inf |
0 / 0 |
NaN |
5 / NA |
NA |
5 / Inf |0|NA|Inf| "logical"class(NaN)| "numeric"class(Inf)| "numeric"class(NULL)` |
“NULL” |
“NAs introduced by coercion” is a common warning message. This can happen if you attempt to make an illegal conversion like inserting a character value into a vector that is otherwise numeric.
as.numeric(c("10", "20", "thirty", "40"))Warning: NAs introduced by coercion[1] 10 20 NA 40NULL is ignored in a vector.
my_vector <- c(25, NA, 10, NULL)  # define
my_vector                         # print
[1] 25 NA 10Variance of one number results in NA.
var(22)[1] NAThe following are useful base R functions when assessing or handling missing values:
is.na() and !is.na()Use is.na()to identify missing values, or use its opposite (with ! in front) to identify non-missing values. These both return a logical value (TRUE or FALSE). Remember that you can sum() the resulting vector to count the number TRUE, e.g. sum(is.na(linelist$date_outcome)).
my_vector <- c(1, 4, 56, NA, 5, NA, 22)
is.na(my_vector)
[1] FALSE FALSE FALSE TRUE FALSE TRUE FALSE!is.na(my_vector)[1] TRUE TRUE TRUE FALSE TRUE FALSE TRUEsum(is.na(my_vector))[1] 2na.omit()This function, if applied to a data frame, will remove rows with any missing values. It is also from base R.
If applied to a vector, it will remove NA values from the vector it is applied to. For example:
na.omit(my_vector)[1] 1 4 56 5 22
attr(,"na.action")
[1] 4 6
attr(,"class")
[1] "omit"drop_na()This is a tidyr function that is useful in a [data cleaning pipeline][Cleaning data and core functions]. If run with the parentheses empty, it removes rows with any missing values. If column names are specified in the parentheses, rows with missing values in those columns will be dropped. You can also use “tidyselect” syntax to specify the columns.
linelist %>%
  drop_na(case_id, date_onset, age) # drops rows missing values for any of these columns
na.rm = TRUEWhen you run a mathematical function such as max(), min(), sum() or mean(), if there are any NA values present the returned value will be NA. This default behavior is intentional, so that you are alerted if any of your data are missing.
You can avoid this by removing missing values from the calculation. To do this, include the argument na.rm = TRUE (“na.rm” stands for “remove NA”).
my_vector <- c(1, 4, 56, NA, 5, NA, 22)

mean(my_vector)
[1] NAmean(my_vector, na.rm = TRUE)[1] 17.6To quickly remove rows with missing values, use the dplyr function drop_na().
The original linelist has nrow(linelist) rows. The adjusted number of rows is shown below:
linelist %>%
  drop_na() %>%     # remove rows with ANY missing values
  nrow()
[1] 1818You can specify to drop rows with missingness in certain columns:
linelist %>%
  drop_na(date_onset) %>% # remove rows missing date_onset
  nrow()
[1] 5632You can list columns one after the other, or use “tidyselect” helper functions:
linelist %>%
drop_na(contains("date")) %>% # remove rows missing values in any "date" column
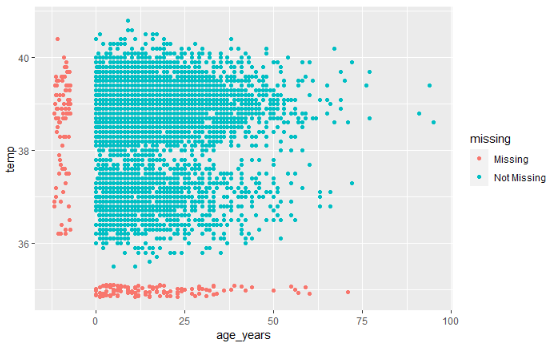
nrow()[1] 3029NA in ggplot()It is often wise to report the number of values excluded from a plot in a caption. Below is an example:
In ggplot(), you can add labs() and within it a caption =. In the caption, you can use str_glue() from stringr package to paste values together into a sentence dynamically so they will adjust to the data. An example is below:
\n for a new line.labs(
title = "",
y = "",
x = "",
caption = stringr::str_glue(
"n = {nrow(central_data)} from Central Hospital;
{nrow(central_data %>% filter(is.na(date_onset)))} cases missing date of onset and not shown.")) Sometimes, it can be easier to save the string as an object in commands prior to the ggplot() command, and simply reference the named string object within the str_glue().